Why BAQ execution plan is so important when you’re moving to Epicor Cloud?
(Or)
Are you designing your BAQ’s efficiently?
Have you heard sometimes your IT Administrator saying that…
- I saw a spike in the memory and CPU usage of the Epicor servers.
- I got a complaint from the end-user that the performance is becoming slow when he/she generates a report or open a dashboard.
(Or)
Even have you ever thought, sometimes why is your BAQ running for minutes and timing out or why does it respond very badly?
Then you’re in the right place.
This could be because of the bad design of the BAQ which can hog the entire server resources, and possibly can even create a severe performance issue in the overall Epicor instance, in turn affecting your colleagues as well.
So, before you design a BAQ in Epicor please have a look into our blog and understand what are the best practises that you must follow.
In simple words, CloudOps team monitors the SQL and any BAQ that is hefty on resources. These will be terminated from the backend and will be notified to respective personnel hence it is very important to understand how SQL execution plan can be utilised in Epicor BAQs.
Firstly, I would like to thank Grant Fritchey for writing such excellent information on what is the general execution plan in SQL. So, here are the basics for you to start with.
What is an execution plan?
Every day, out in the various discussion boards devoted to Microsoft SQL Server, the same types of questions come up again and again: Why is this query running slow? Is my index getting used? Why isn’t my index getting used? Why does this query run faster than another query? The correct response is probably different in each case, but to arrive at the answer, you must ask the same return question in each case: have you looked at the execution plan? An execution plan is the result of the query optimiser’s attempt to calculate the most efficient way to implement the request represented by the T-SQL query you submitted.
Execution plans can tell you how a query will be executed or how a query was executed. They are, therefore, the DBA’s primary means of troubleshooting a poorly performing query. Rather than guess at why a given query is performing thousands of scans, putting your I/O usage through the roof, you can use the execution plan to identify the exact piece of SQL code that is causing the problem. For example, it may be scanning an entire table-worth of data when, with the proper index, it could simply scan out only the rows you need. All this and more is displayed in the execution plan.
What happens when a query is submitted?
When you submit a query to a SQL Server database, several processes on the server are applied to that query. The purpose of these processes is to manage the system such that it will provide your data back to you, or store it, in as timely a manner as possible, while maintaining the integrity of the data.
These processes are run for each query submitted to the system. While there are lots of different actions occurring simultaneously within SQL Server, we’re going to focus on the processes around T-SQL. The processes can be categorized into two stages:
- Processes that occur in the relational engine
- Processes that occur in the storage engine
In the relational engine, the query is parsed and then processed by the Query Optimizer, which generates an execution plan. The execution plan is then sent (in a binary format) to the storage engine, which uses it to retrieve or update the underlying data. The storage engine is where processes such as locking, index maintenance and transactions occur. Since execution plans are created in the relational engine, that’s where we’ll be focusing our attention.
Query Parsing
When you pass a T-SQL query to the SQL Server system, the first place it goes to is the relational engine.
As the T-SQL query arrives, it passes through a process that checks whether the T-SQL query is written correctly and that it’s well-formed. This process is known as query parsing. The output of the Parser process is a parse tree, or query tree (or even sequence tree). The parse tree represents the logical steps necessary to execute the query that has been requested.
If the T-SQL string is not a data manipulation language (DML) statement, it will be not be optimised because, for example, there is only one “right way” for the SQL Server system to create a table; therefore, there are no opportunities for improving the performance of those type of statements. If the T-SQL string is a DML statement, the parse tree is passed to a process called the algebrizer. The algebrizer resolves all the names of the various objects, tables and columns, referred to within the query string. The algebrizer identifies, at the individual column level, the data types of objects being accessed (varchar(50) versus nvarchar(25) and so on). It also determines the location of aggregates (such as GROUP BY, and MAX) within the query, by a process called aggregate binding. This algebrizer process is important because the query may have aliases or synonyms, or names that don’t exist in the database. The algebrizer resolves all the names of the different objects that are being referenced in the T-SQL query so that the query will not be referring to objects, not in the database. If it finds any non-existent objects, the algebrizer process throws an error.
The algebrizer outputs a binary called the query processor tree, which is then passed on to the query optimizer.
The Query Optimizer
The query optimizer is essentially a piece of software that “models” the way in which the database relational engine works. Using the query processor tree and the statistics it has about the data, the query optimizer applies the model and works out what it thinks will be the optimal way to execute the query – that is, it generates an execution plan.
In other words, the optimizer figures out how best to implement the request represented by the T-SQL query you submitted. It decides if the data can be accessed through indexes, what types of joins to use and much more. The decisions made by the optimizer are based on the cost of a given execution plan which is calculated by considering factors like the required CPU processing and I/O, and how fast it will execute. Hence, this is known as a cost-based plan.
Query Execution
Once the execution plan is generated, the action switches to the storage engine, where the query is executed, as per the plan.
We will not go into detail here, except to note that the carefully generated execution plan may be subject to change during the actual execution process. For example, this might happen if:
- A determination is made that the plan exceeds the threshold for parallel execution (an execution that takes advantage of multiple processors on the machine).
- The statistics used to generate the plan were out of date, or have changed since the original execution plan was created by the optimizer.
The results of the query are returned to you after the relational engine changes the format to match to what was requested in your T-SQL statement, assuming it was a SELECT
Estimated and Actual Execution Plans
As discussed previously, there are two distinct types of execution plans. First, there is a plan that represents the output from the optimizer which is known as the Estimated Execution Plan. The operators, or steps, within the plan will be labelled as logical because they’re representative of the optimizer’s view of the plan.
Next is the plan that represents the output from the actual query execution which is known as the Actual execution plan. It shows what happened when the query was executed. Generally, you probably won’t see any differences between your estimated and actual execution plans. However, circumstances can arise where estimated and actual execution plans may differ.
Execution Plan Formats
SQL Server offers only one type of execution plan (be it estimated or actual), but provides three different formats in which you can view that execution plan.
- Graphical Plans
- Text Plans
- XML Plans
The one you choose will depend on the level of detail you want to see, and on the individual DBA’s preferences and methods.
Graphical Plans
These are quick and easy to read but the detailed data for the plan is masked. Both Estimated and Actual execution plans can be viewed in graphical format.
Text Plans
These are a bit harder to read, but more information is immediately available. There are three text plan formats:
- SHOWPLAN_ALL : a reasonably complete set of data showing the Estimated execution plan for the query
- SHOWPLAN_TEXT : provides a very limited set of data for use with tools like osql.exe. It too only shows the Estimated execution plan
- STATISTICS PROFILE: similar to SHOWPLAN_ALL except that it represents the data for the Actual execution plan
XML Plans
XML plans present the most complete set of data available on a plan, all on display in the structured XML format. There are two varieties of XML plan:
- SHOWPLAN_XML: The plan generated by the optimiser before execution.
- STATISTICS_XML : The XML format of the Actual execution plan.
Getting started and working with the execution plan in Epicor Business Activity Queries
Execution plans are there to assist you in writing efficient T-SQL code, troubleshooting existing T-SQL behaviour or monitoring and reporting on your systems. How you use them and view them is up to you. But first you need to understand the information contained within the plans and how to interpret it. One of the best ways to learn about execution plans is to see them in action, so let’s get started.
As everyone knows, we use the Business Activity Query (BAQ) Designer to create personalized queries (BAQs) and to copy system queries so that we can modify them. Queries can be accessed in different ways throughout the Epicor ERP application.
Logic/Algorithms: : The business activity query functionality uses this logic to display data across multiple companies.
- When you select the Global check box, you indicate that this BAQ is available for use in other companies. After you save this query, the BAQ is stored on an internal multi-company table. This BAQ is then replicated out to other companies set up for multi-company.
- When you select the Cross-Company check box, you indicate that this BAQ can pull in data from other companies. Unlike the rest of the multi-site functionality, however, cross company BAQs do not pass data through the multi-company process. Instead, this logic uses the server URL to pass information between the BAQ tables within the multiple companies.
After a query is built, use the “Analyse” sheet to check the syntax (Analyse) and use the “Test” button to execute the query and view results so that you can test the accuracy of the results. After your query displays your result or have dropped the execution after sometime due to any reason, Epicor will create an execution plan for the query built automatically. This “.Sqlplan” file will show you the itinerary of your query. This execution plan will help you find out the reasons why the query is being executed for a long duration or why it is going to an infinite loop.
Interpreting Graphical Execution Plan
The icons you see in Figure 1 represent various actions and decisions that potentially make up an execution plan. On the left is the SELECT icon, an icon that you’ll see quite a lot of times and that you can usually completely ignore. It’s the result and formatting from the relational engine. The icon on the right represents a table scan. This is the first, and one of the easiest, icons to look for when trying to track down performance problems.
Usually, you read a graphical execution plan from right to left and top to bottom. You’ll also note that there is an arrow pointing between the two icons. This arrow represents the data being passed between the operators, as represented by the icons. So, in this case, we simply have a table scan operator producing the result set (represented by the Select operator). The thickness of the arrow reflects the amount of data being passed, thicker the arrow meaning more rows. This is another visual clue as to where performance issues may lie. You can hover with the mouse pointer over these arrows and it will show the number of rows that it represents. For example, if your query returns two rows, but the execution plan shows a big thick arrow indicating many rows being processed, then that’s possibly something to be investigated.
Below each icon is displayed a number as a percentage. This number represents the relative cost to the query for that operator. That cost, returned from the optimizer, is the estimated execution time for that operation. In our case, all the cost is associated with the table scan. While a cost may be represented as 0% or 100%, remember that, as these are ratios, not actual numbers, even a 0% operator will have a small cost associated with it.
Above the icons, the query string (as much as that fits in the screen) and a cost (relative to batch) in percentage is displayed. Just as each query can have multiple steps, and each of those steps will have a cost relative to the query, you can also run multiple queries within a batch and get execution plans for them. They will then show up as different costs as a part of the whole.
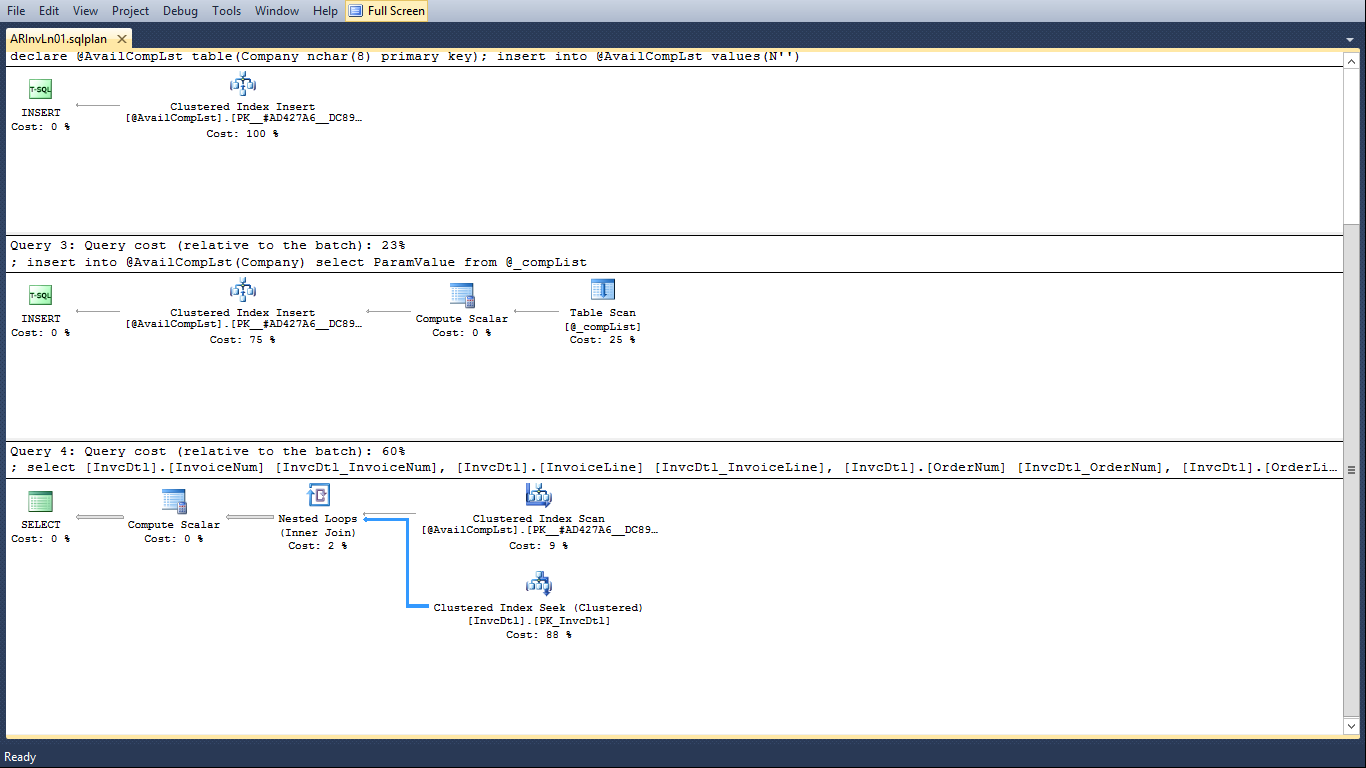
Figure 1
Tool Tips
Each of the icons and the arrows has a pop-up window associated with it called a ToolTip, which you can access by hovering your mouse pointer over the icon.
Pull up the Estimated execution plan, hover over the SELECT operator, and you should see the ToolTip window shown in Figure 3.
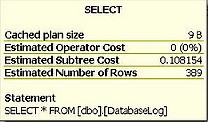
Figure 2
Here we get the numbers generated by the optimizer on the following:
Cached plan size – How much memory the plan generated by this query will take up in stored procedure cache. This is a useful number when investigating cache performance issues because you’ll be able to see which plans are taking up more memory.
Estimated Operator Cost – We’ve already seen this as the percentage cost
Estimated Subtree Cost – Tells us the accumulated optimizer cost assigned to this step and all previous steps, but remember to read from right to left. This number is meaningless in the real world, but is a mathematical evaluation used by the query optimizer to determine the cost of the operator in question. It represents the amount of time that the optimizer thinks this operator will take.
Estimated number of rows – Calculated based on the statistics available to the optimizer for the table or index in question.
Below this information, we see the statement that represents the entire query that we’re processing. If we look at the ToolTip information for the Table Scan we see the information in Figure.
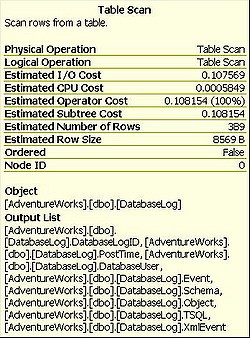
Figure 3
The I/O Cost and CPU cost are not actual operators, but rather the cost numbers assigned by the Query Optimizer during its calculations. These numbers are useful when determining whether most of the cost is I/O-based (as in this case), or if we’re putting a load on the CPU. A bigger number means more processing in this area. Again, these are not hard and absolute numbers, but rather pointers that help to suggest where the actual cost in each operation may lie.You’ll note that, in this case, the operator cost and the subtree cost are the same, since the table scan is the only operator. For more complex trees, with more operators, you’ll see that the cost accumulates as the individual cost for each operator is added to the total. You get the full cost of the plan from the final operation in the query plan, here in this case the Select operator. Again, we see the estimated number of rows. This is displayed for each operation because each operation is dealing with different sets of data. When we get to more complicated execution plans, you’ll see the number of rows change as various operators perform their work on the data as it passes through each operator. Knowing how the rows are added or filtered out by each operator helps you understand how the query is being performed within the execution process.
Another important piece of information, when attempting to troubleshoot performance issues, is the Boolean value displayed for Ordered. This tells you whether the data that this operator is working with is in an ordered state. Certain operations, for example, an ORDER BY clause in a SELECT statement may require data to be placed in an order or sort by a value or set of values. Knowing whether the data is in an Ordered state helps you understand where extra processing may be occurring to get the data into that state.
Finally, Node ID is ordinal, which means numbered in order, of the node itself, numbered left to right, even though the operations are best read right to left.
All these details are available to help you understand what’s happening within the query in question. You’ll be able to walk through the various operators, observing how the subtree cost accumulates, how the number of rows changes, and so on. With these details, you’ll be able to identify processes that are using excessive amounts of CPU or tables that need more indexes, indexes that are not used, and so on.
Operator Properties
More information is available in the Operator Properties than that presented in the ToolTips. Right-click any icon within a graphical execution plan and select the “Properties” menu item to get a detailed list of information about that operation. Figure 5 shows the details from the original table scan.
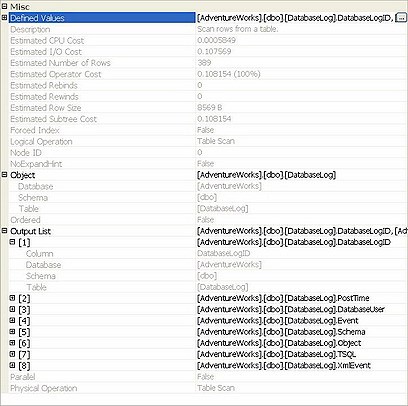
Most of this information may be familiar, but some of it may be new to you. Starting from the top, Defined Values displays the information that this operation adds to the process. These can be a part of the basic query, in this case, the columns being selected, or they can be internally created values as part of the query processing, such as a flag used to determine referential integrity, or a placeholder for counts for aggregate functions.
Under the Defined Values, we get a description of the operation and then some familiar Estimated Cost data.
After that we see, Estimated Rebinds and Rewinds, values which describe the number of times an Init() operator is called in the plan.
The Forced Index value would be True when a query hint is used to put a specific index to use within a query. SQL Server supplies the functionality in query hints to give you some control over how a query is executed. Query hints are covered in detail in the book.
No Expand Hint which is roughly the same concept as Forced Index, but applied to indexed views.
By expanding the Object property, you can see details on the object in question. The Output List property provides details of each of the output columns. You’ll also find out whether this operator is taking part in parallel operation (when multiple CPUs are used by one operator).
How Epicor had made it simple for the designer?
Use the Get Query Execution Plan to retrieve and save the .sqlplan execution file. You can later open this file in the SQL Server Management Studio to examine the query execution.
This feature is available for both internal and external MS SQL queries. This command requires the VIEW SERVER STATE permission for the IceContext connection.
- From the Actions menu, select Get Query Execution Plan.
- In the Save SQL Server Query Execution Plan window, you can specify the name and the location where you want to save the .sqlplan file. By default, the file is named using the following format: <QueryID>.sqlplan
- Once the file is saved, open it using the SQL Server Management Studio for further analysis
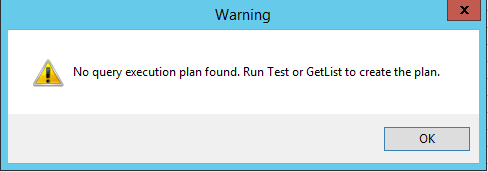
Please note that if you do not execute/Test or GetList from the BAQ screen, you might get the below message. To produce the SQL plan, a BAQ must be executed in the designer screen.
After you execute/Test the query from an Epicor BAQ screen use the Get Query Execution Plan to generate your SQL Plan.
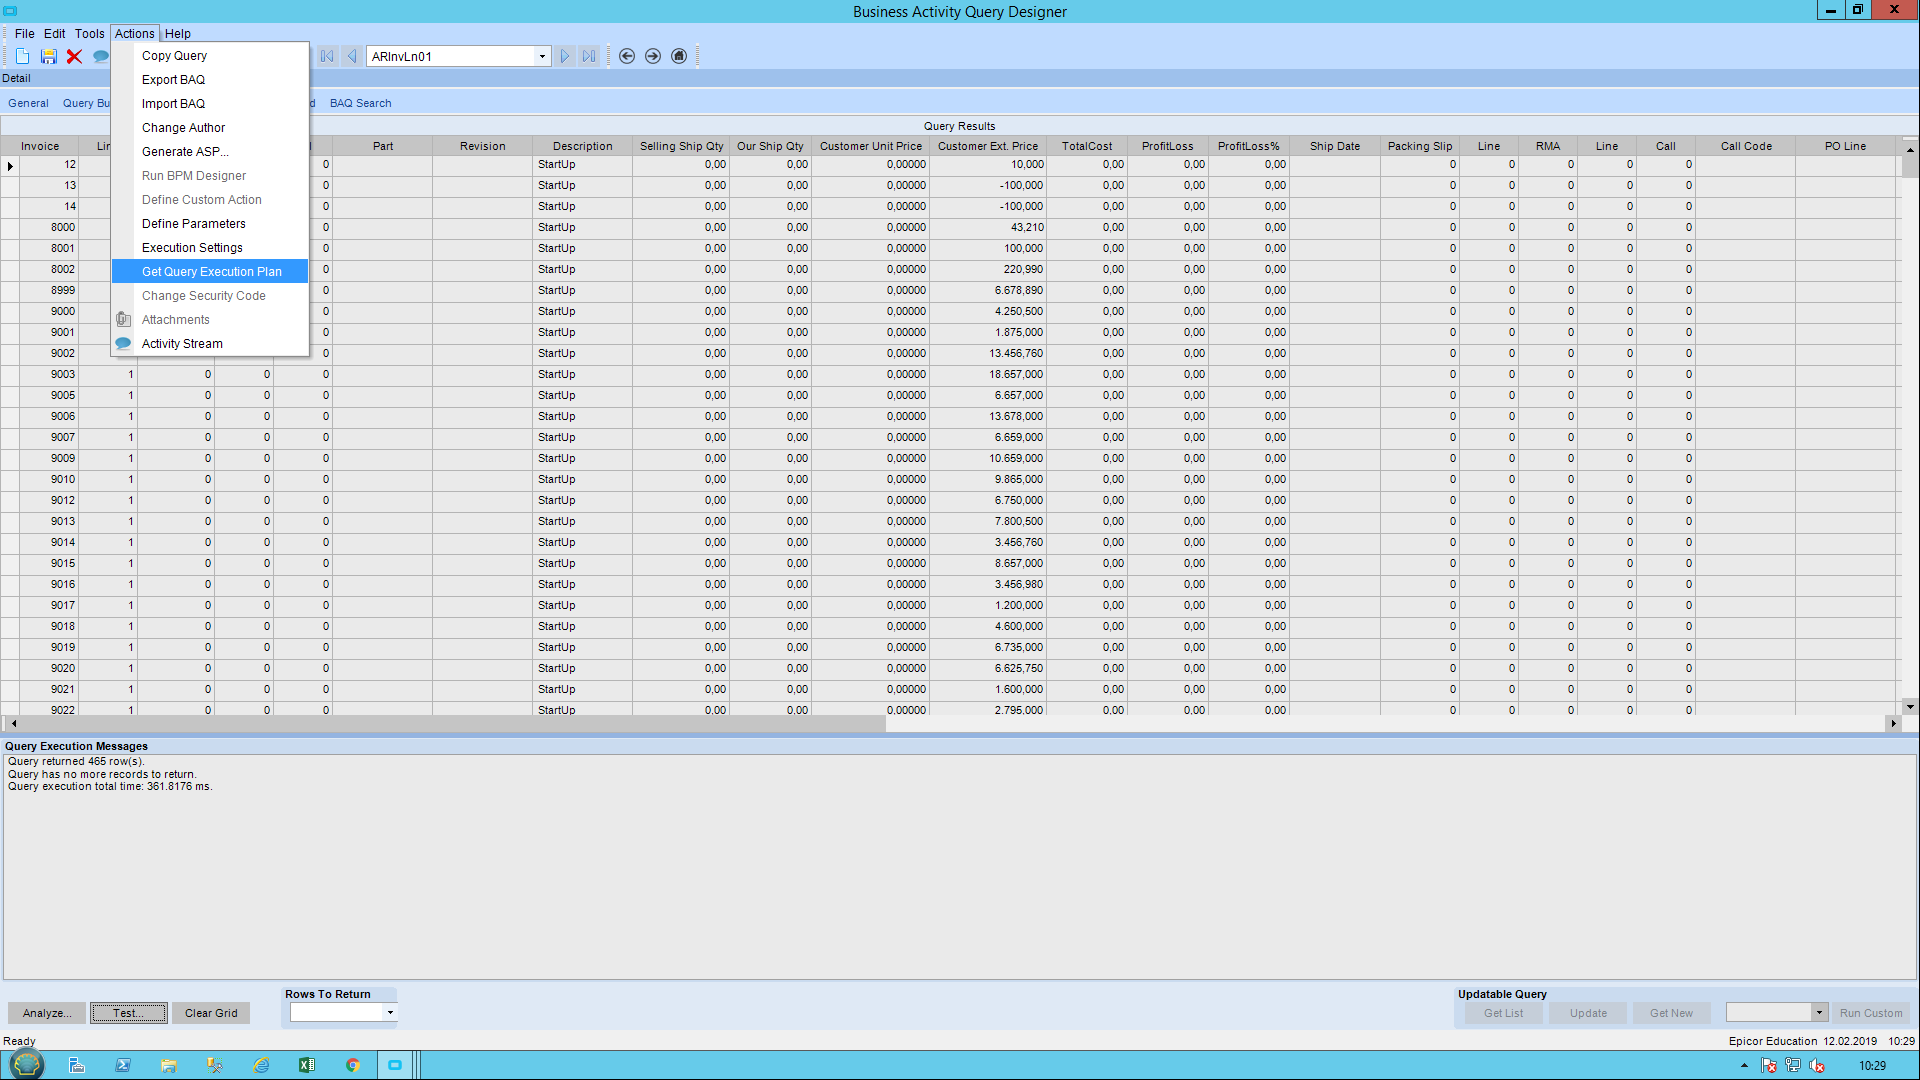
Figure 6
Well, we know it is a lot of information, but we always believe that having a strong foundation is a key to understanding the concept because understanding is much deeper than knowledge.
For any assistance in handling complex BAQ’s please contact us!
Happy BAQ’ing 😉


